Viewing coverage
There are four ways to view collected coverage:
- Terminal
- Coverage report (standalone HTML)
- Web viewer
- Electron Mac app
The recommended workflow is to export a .bktgz archive from your testbench and
open it in the viewer. Coverage is processed locally in the browser or desktop
app — nothing is uploaded.
Terminal
Bucket can print a summary or full tables of coverage collected during a simulation. The summary view is useful at the end of a test run, or to summarise a regression after merging.
    ...
    readout = PointReader(context_hash).read(cvg)
    ConsoleWriter().write(readout)
    ...
ConsoleWriter options:
| Parameter | Default | Description |
|---|---|---|
| axes | False | Print name and description of all axes for all coverpoints |
| goals | False | Print name and description of all goals for all coverpoints |
| points | False | Print hit count and goal for all buckets for each coverpoint |
| summary | True | Print a summary of hits for each coverpoint in the tree |
From the command line:
python -m bucket write -r sql:./example.db console --summary
python -m bucket write -r archive:./run.bktgz console --points
See Exporting and merging coverage for the full -r
readout syntax.
Coverage report
Bucket can write a human-readable, self-contained HTML document describing the coverage tree — point names, descriptions, motivations, tier and tags, axes and their values, goals, bucket counts, targets, per-tier/per-tag summary tables, and recorded results. It is intended for design/verification reviews: each covergroup and coverpoint is a clearly bounded, collapsible card, with a linked tree overview. On wide screens the tree becomes a sticky sidebar with a filter box, expand/collapse controls, and a highlight that tracks your scroll position (these enhancements degrade gracefully when scripts are unavailable). Hits are shown with colour-coded percentages when present; a readout with no recorded hits (a plan review before any run) drops the results entirely rather than printing 0% everywhere. Print it from the browser for a PDF.
The report always includes every section it knows about; the only options narrow which coverpoints appear (and cap how many axis values are listed).
python -m bucket write -r archive:./run.bktgz report -o coverage_report.html

# Focused review: one covergroup, high-priority tiers only
python -m bucket write -r archive:./run.bktgz report -o dogs.html --point "Pets.dogs" --max-tier 1
Or from Python:
from bucket.rw import ReportWriter

ReportWriter(output="coverage_report.html").write(readout)
Contiguous numeric axis values are collapsed into ranges for readability
(e.g. 0..18 or universe_[00..39]).
The report itself is generated by the web viewer's shared report module, so
node/npm and a Bucket source checkout (with npm install in viewer/)
are required. A pip install of noodle-bucket does not include the viewer;
export a .bktgz and open it in the hosted viewer or desktop app instead.
The viewer's Export dialog can also save the same report via the
.html (Coverage Report) format.
ReportWriter options (CLI flags use dashes, e.g. --max-tier):
| Parameter | Default | Description |
|---|---|---|
| max_axis_values | 64 | Cap on listed values per axis (0 = unlimited) |
| max_tier | None | Only include coverpoints with tier <= this value |
| tags | None | Only include coverpoints with at least one of these tags |
| point | None | Only include coverpoints matching a dotted-path glob (e.g. Pets.dogs*); naming a covergroup selects its subtree |
When filters are active the report notes them under the metadata table, and covergroup bucket counts and the rollup tables reflect only the included coverpoints.
Web viewer
The hosted viewer is available at https://noodle-bytes.github.io/bucket/
You can also generate a standalone HTML file that embeds the viewer (requires a source checkout and Node.js, not a pip install):
python -m bucket write -r archive:./run.bktgz html -o index.html
Open the HTML file in your browser, or load .bktgz archives directly in the
hosted viewer.
Loading coverage
On the empty state, use Open File… or drag and drop one or more .bktgz
files. While coverage is loading, a progress overlay shows how many archives have
been read and when the viewer is applying them to the session.
When more than one archive is selected in a single action, a dialog offers:
| Option | Result |
|---|---|
| Compare (two files only) | Load each archive as its own record and open compare mode |
| Load individually | Add each archive as separate loaded record(s) |
| Merge into one | Merge all archives into a single in-session record |
| Cancel | Abort the load |
Loading 50 or more archives individually shows a warning that this may slow the viewer. Merged results exist only for the current session — use Export to save them.
Navigating coverage
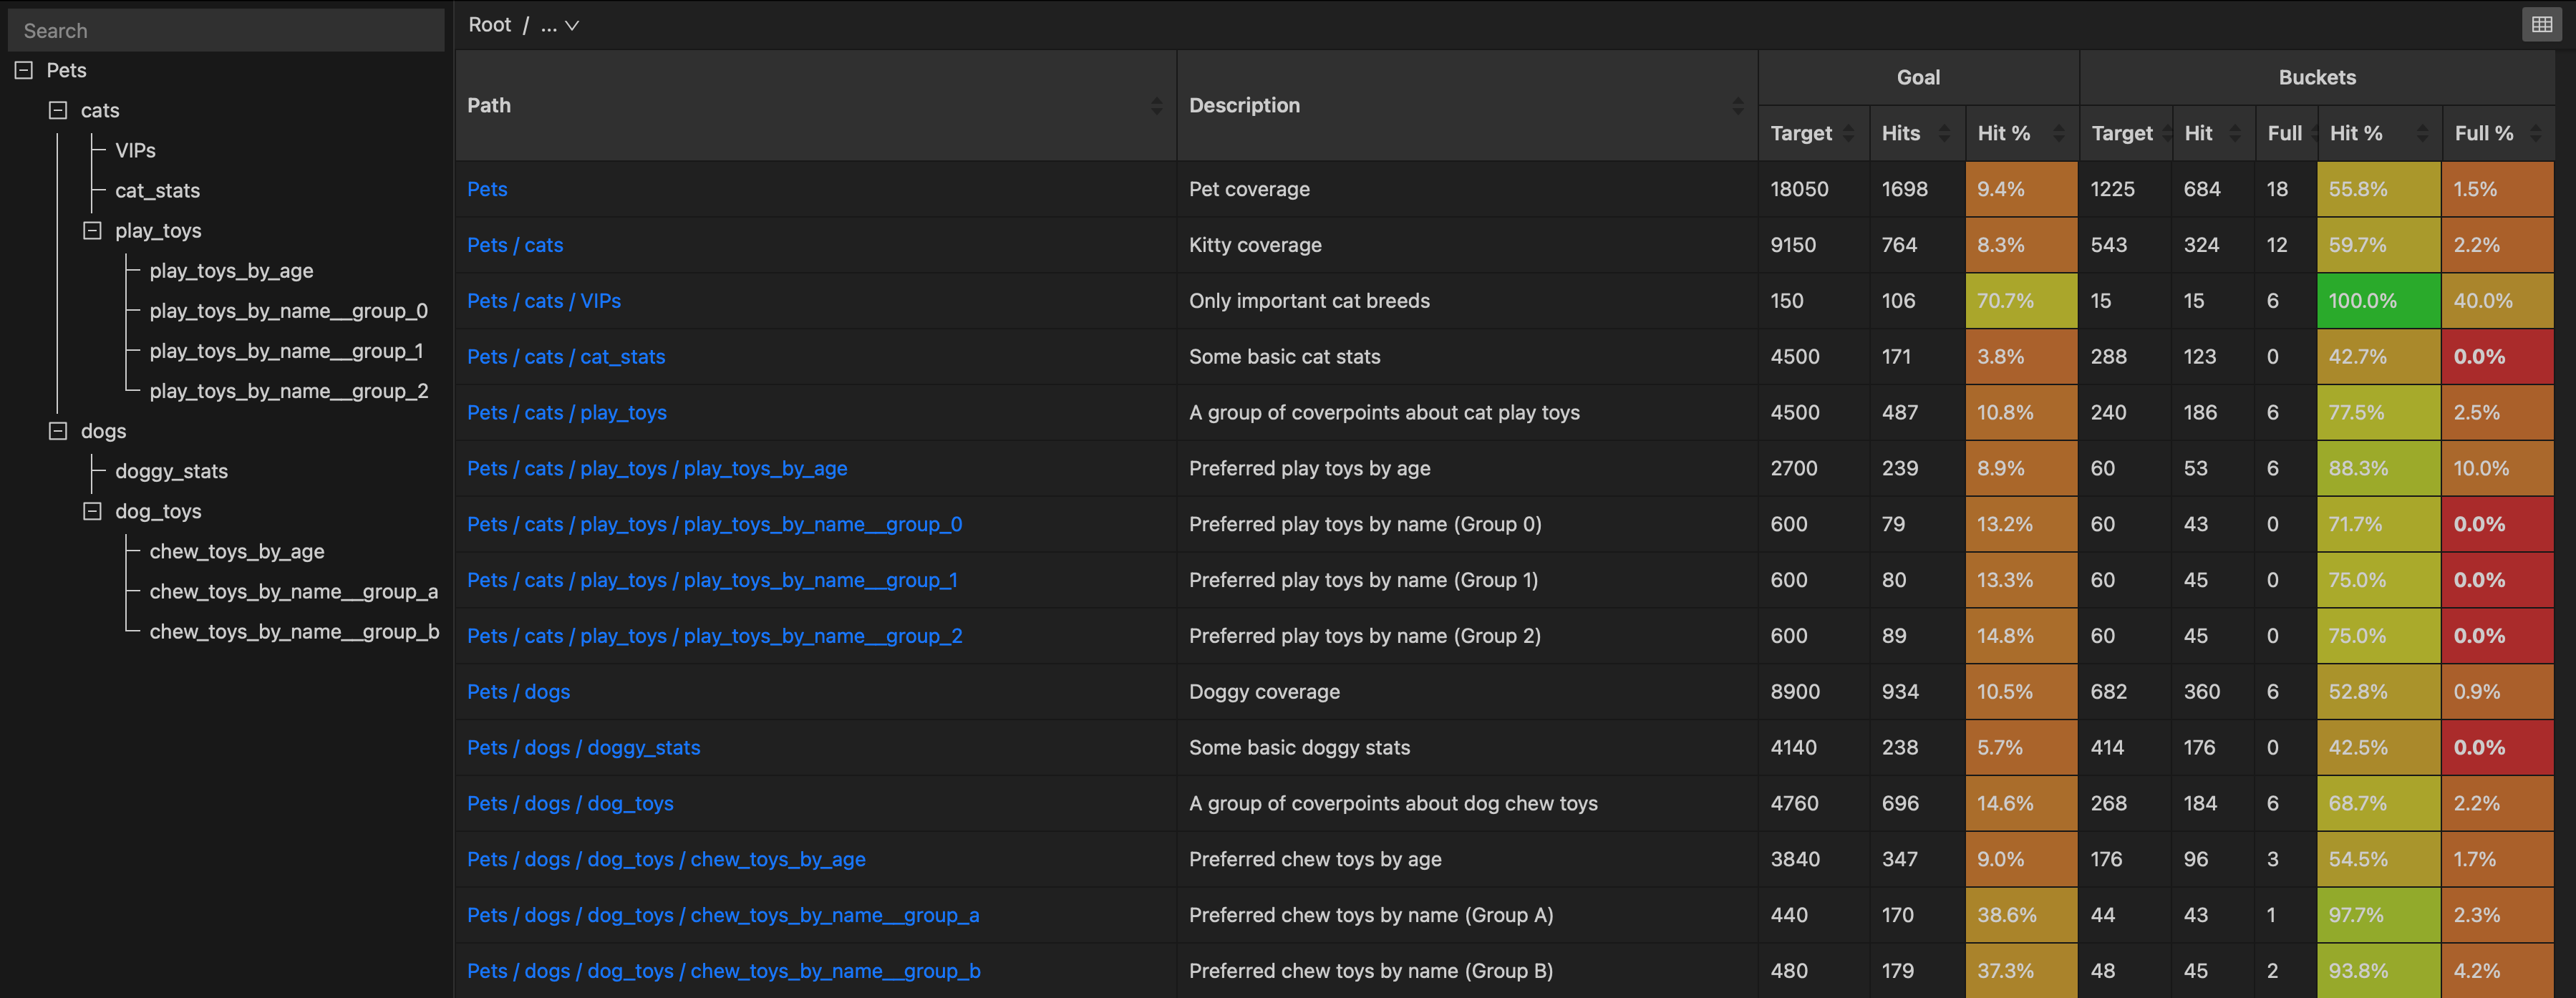
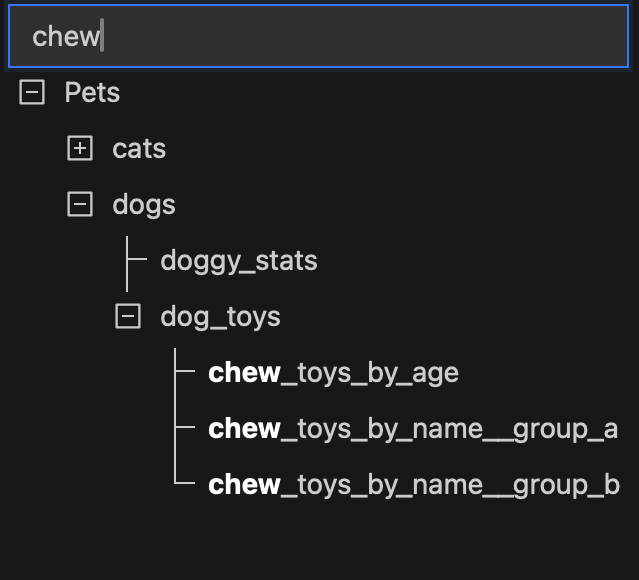
The navigation tree on the left can be expanded, collapsed, and searched.
| Statistic | Description |
|---|---|
| Goal Targets | Total number of all bucket targets |
| Goal Hits | Total number of hits (capped at each bucket's target) |
| Buckets target | Number of targets (not their value, excluding illegal and ignore) |
| Buckets Hit | Number of buckets with at least 1 hit |
| Buckets Full | Number of fully saturated buckets (hits >= target) |
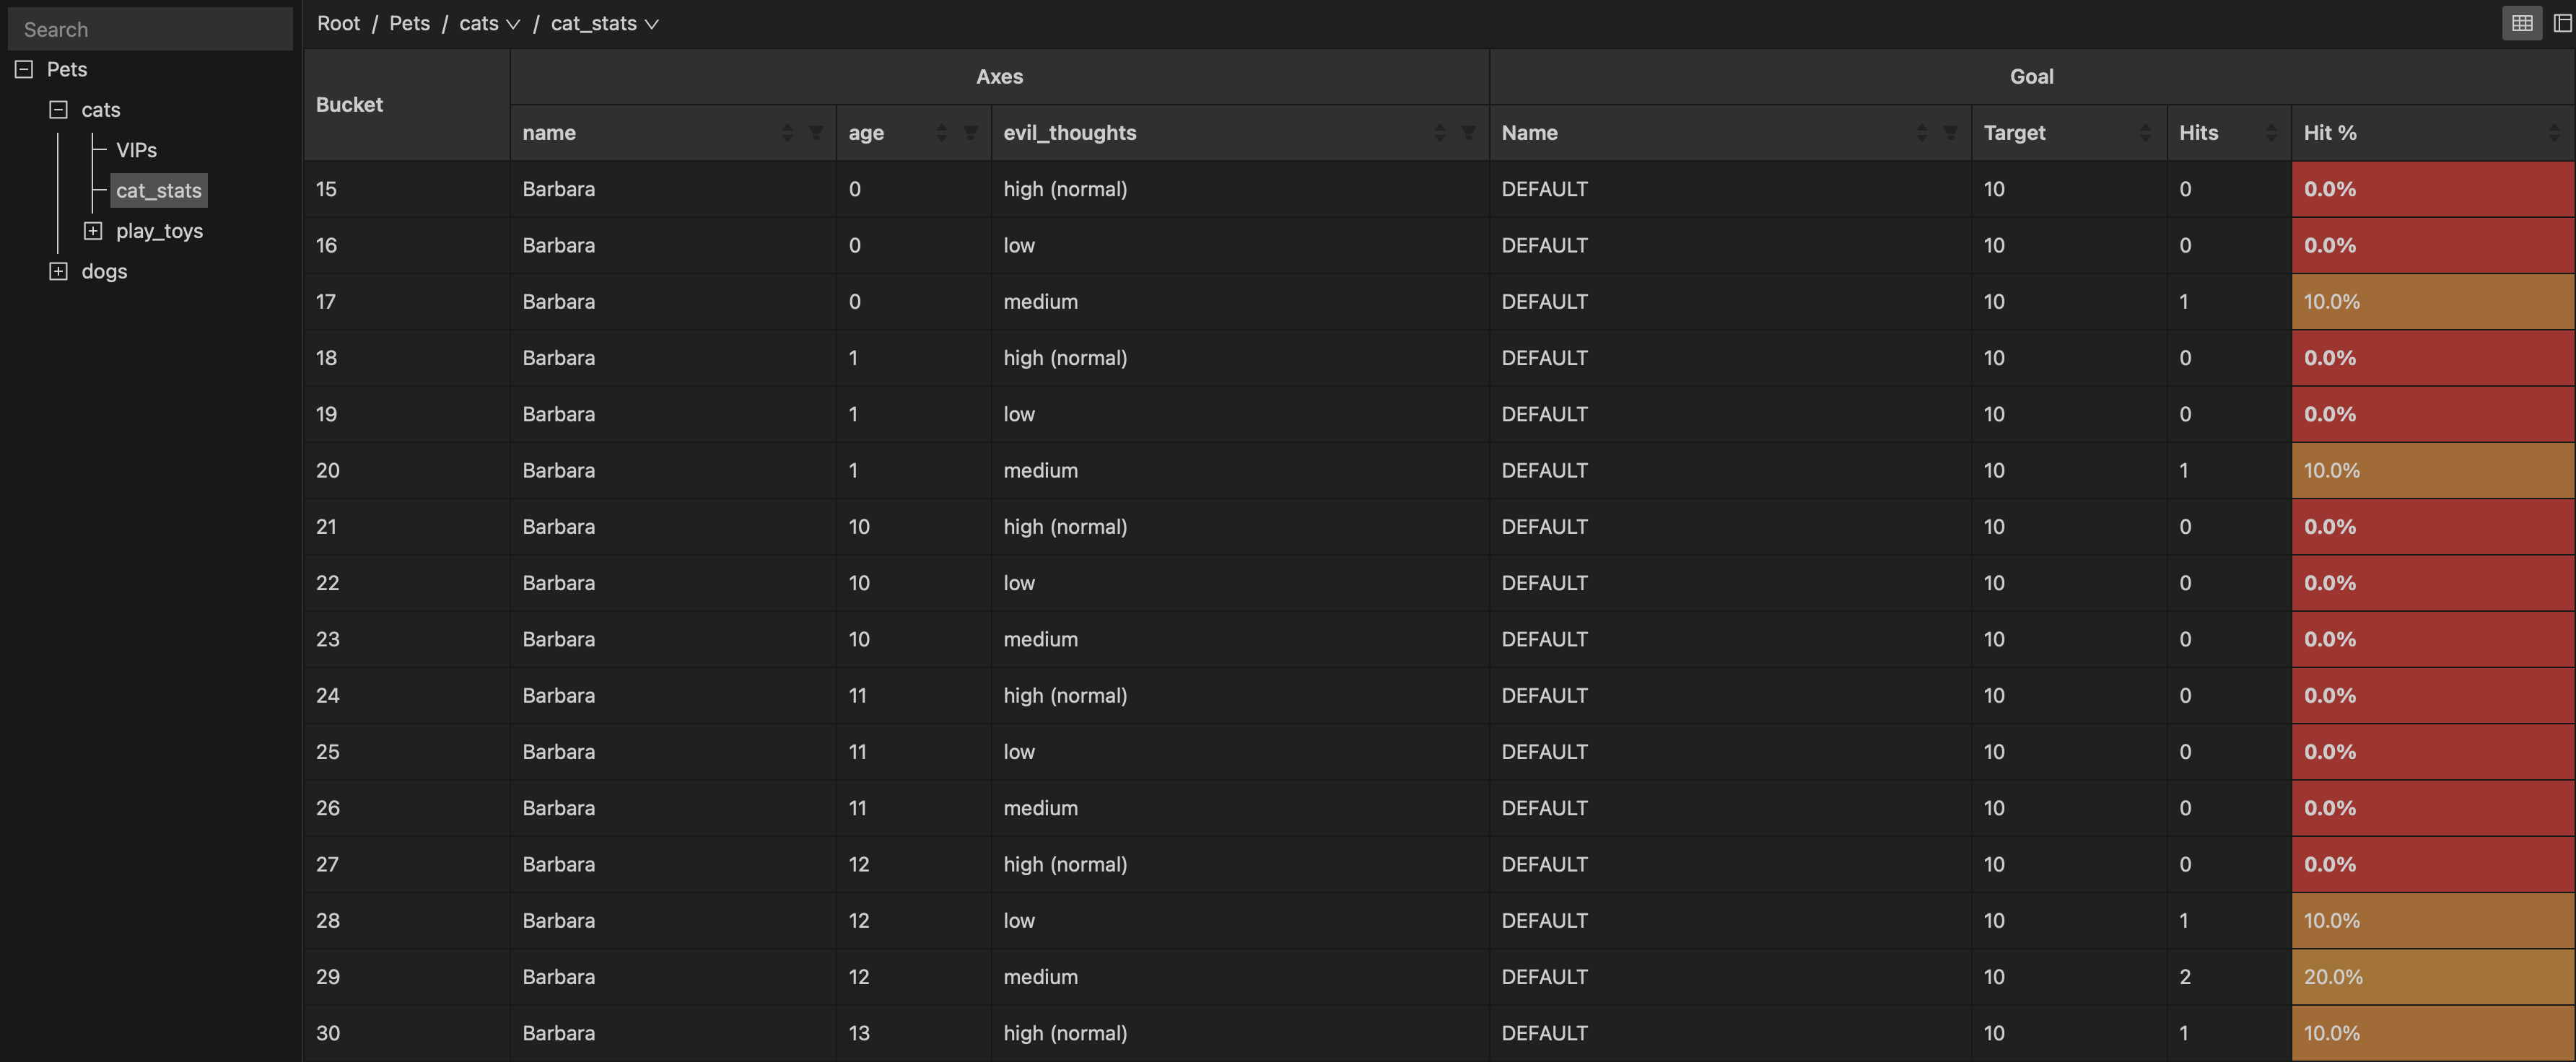
Selecting a coverpoint shows its buckets, goals, hit counts, and hit percentage. Axis columns and goal names can be filtered; columns can be sorted. Summary views also support tier and tag filters, and can be shown as a table or donut chart.
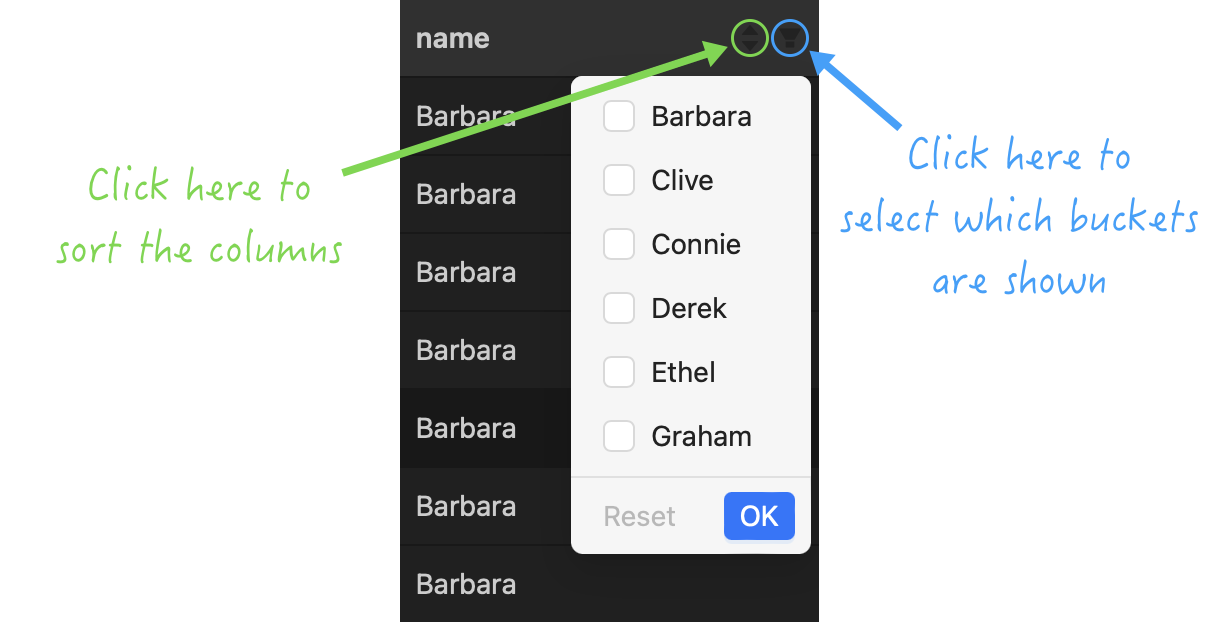
Coverpoints with more than 50,000 buckets automatically use optimized large-table mode: a virtualized table with dropdown-based filtering and sorting. You can optionally enable full per-column features if needed.
Session management
Once coverage is loaded, the header provides:
| Action | Description |
|---|---|
| Load | Append more .bktgz archives |
| Edit | Choose which records are loaded, or merge selected records |
| Refresh | Reload file-backed records from disk (Electron) or re-select files (browser) |
| Export | Save loaded record(s) as .bktgz, JSON, or an HTML coverage report |
| Compare | Enter compare mode when compatible records are available |
| Clear | Remove all loaded coverage from the session |
A single .bktgz archive can contain multiple records. The Edit dialog shows
each record's source and lets you toggle which records contribute to the tree.
Compare mode
Compare mode shows bucket-level differences between two coverage records that
share the same covertree definition (def_sha).
To start compare:
- Load two
.bktgzfiles together and choose Compare, or - Load records individually, then click Compare in the header.
The compare toolbar lets you choose records A and B, a coverage definition (Any hit or Met goal), and a set filter:
| Set filter | Shows buckets where |
|---|---|
| A only | Covered in A but not B |
| Both | Covered in both |
| B only | Covered in B but not A |
| Neither | Covered in neither |
| All | All valid buckets (use category filters in large tables) |
Summary cards show counts and percentages for each category. While compare is active, the tree, summary table, and coverpoint tables add compare columns and category highlighting.
Use Generate report to export an HTML or JSON compare report. The report includes global statistics, asymmetric coverage patterns, coverpoints with differences, and per-category bucket lists.
To try compare locally:
python tools/gen_compare_fixtures.py
This writes compare_a.bktgz and compare_b.bktgz with the same covertree but
different hit data.
Electron Mac app
The Electron app provides a native Mac experience for viewing .bktgz archives.
See electron/README.md for build instructions.
Open archives via File > Open, drag and drop, double-click (when associated with the app), or Open Recent. The same load, compare, export, and session features are available as in the web viewer.
Prev: Reading and Writing
Back to index: Index